
Properly calibrated scale bars are essential for scientific image integrity. Always measure a known distance with a calibration slide to establish your pixels-to-micron ratio under identical imaging conditions. Set this scale in ImageJ via Analyze > Set Scale, checking the “Global” option for consistency. Apply uniform scale bars across your dataset using batch processing tools in ImageJ or Photoshop actions. These practices guarantee accurate data interpretation and reproducibility—fundamental requirements for publishing your research with confidence.
Quick Scale Bar Tips For Scientific Imaging
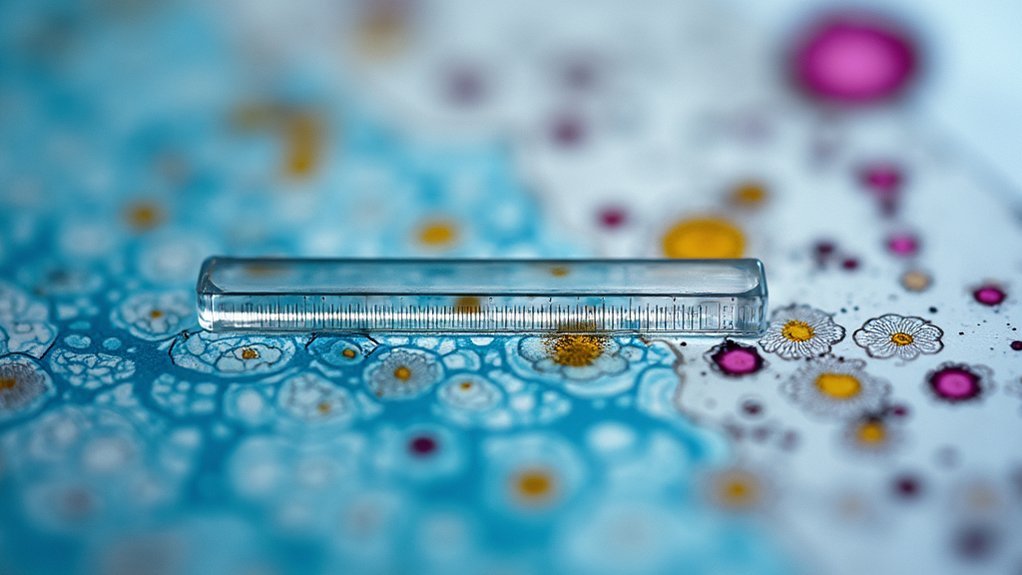
When working with scientific images, accurate scale bars are essential for proper data interpretation and reproducibility. To add a scale bar correctly, always calibrate your imaging software first using a micrometer or known reference object to establish a precise pixels-to-micron ratio.
Scale bars are non-negotiable elements in scientific imaging—they transform pretty pictures into quantifiable, reproducible data.
In ImageJ, set the image scale through Analyze > Set Scale, entering your calibration values (such as 11.82 pixels/µm for a 40x objective), and select “Global” to maintain consistency across all images.
Customize your scale bar’s appearance through Analyze > Tools > Scale Bar, adjusting width, color, and font size for ideal visibility against your background. For efficiency, consider creating Photoshop actions to automate scale bar generation for batch processing.
Always photograph reference scales alongside your specimens to guarantee accurate size representation in all your scientific imaging work.
Calibration Fundamentals: Pixels to Microns Conversion
At the heart of accurate scale bars lies proper calibration—the process that bridges the digital world of pixels to real-world measurements.
To properly calibrate, you’ll need to measure a known distance using a calibration slide under identical imaging conditions as your sample.
For example, if a 200µm distance spans 2364 pixels at 40x magnification, your conversion ratio is 11.82 pixels/µm (2364 pixels/200µm). This ratio typically falls between 11.7-11.9 pixels/µm for this magnification.
To set this in ImageJ, navigate to Analyze > Set Scale and enter your determined ratio with appropriate units.
Remember that you’ll need to reapply this setting if the program restarts, so always record your calibration data.
Proper calibration guarantees you’re creating scale bars using accurate pixels to microns conversion values.
Setting Up ImageJ for Accurate Scale Measurement
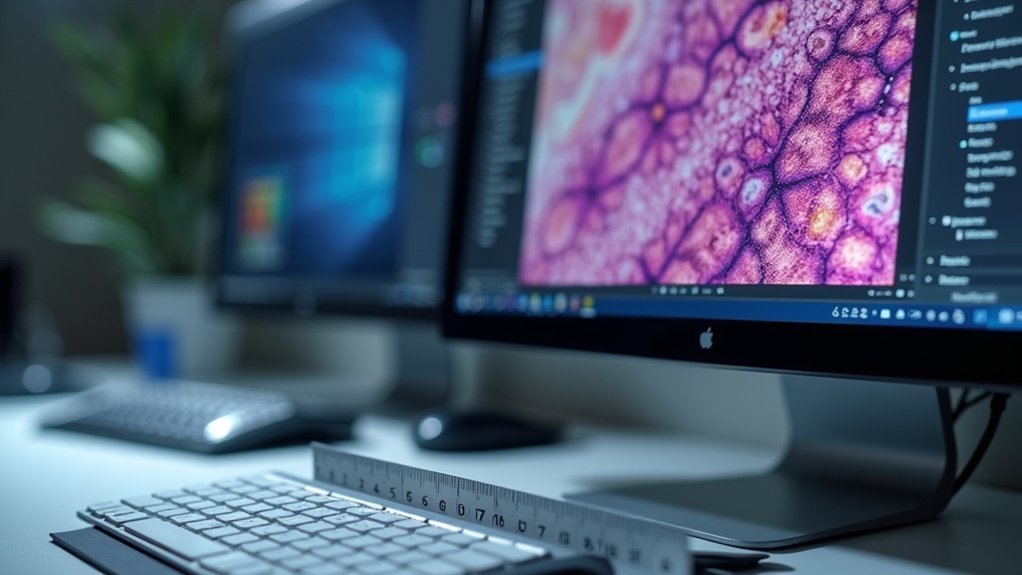
Once you’ve determined your calibration ratio, properly configuring ImageJ becomes essential for consistent, accurate measurements.
Navigate to Analyze > Set Scale and input your conversion value (such as 11.82 pixels/µm for a 40x objective) along with the appropriate units. Be sure to check the “Global” option to apply this scale to all images in your session, which streamlines your analysis workflow.
Remember that ImageJ won’t automatically save these settings if the program crashes or restarts. Keep a record of your calibration ratios for quick setup in future sessions.
To make a scale bar, you’ll need these calibrated settings active in your analysis software. Regularly verify that your saved calibration matches your current microscope magnification to maintain measurement accuracy across different imaging sessions.
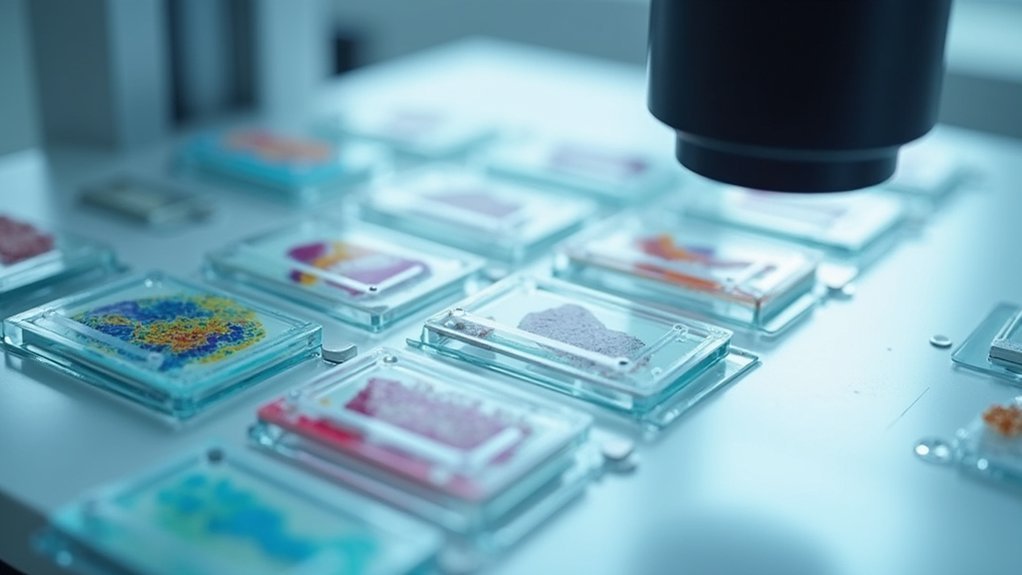
Creating Consistent Scale Bars Across Multiple Images
Since your published images will be judged on their professional presentation, maintaining uniform scale bars across all figures is critical.
When adding scale bars to your microscopy images, always use the same calibration slide under identical imaging conditions to establish consistent pixel-to-micron ratios.
Record the conversion ratio for each objective (e.g., 11.82 pixels/µm at 40x) and apply it uniformly during image analysis. In ImageJ, use “Set Scale” with the “Global” option checked to guarantee this ratio applies across all images in your session.
For visual consistency, maintain identical width and height specifications when you make scale bars.
Consider automating this process with a Photoshop action or script that applies the same style parameters, saving time while guaranteeing your figures meet publication standards.
Automated Workflows for Batch Scale Bar Application
When dealing with large datasets, manually adding scale bars to each image becomes impractical and inefficient. Instead, leverage Photoshop’s action recording capability to create automated workflows that streamline this process.
Simply record yourself adding a scale bar to one image, then save this as a reusable action. Apply your custom action to multiple images using Photoshop’s File > Automate > Batch feature, which processes entire folders while maintaining consistent scale bar appearance.
Before batch processing, verify your images are well-organized with clear naming conventions to avoid confusion.
For scientific imaging, consider specialized tools like ImageJ that offer built-in scale bar functions designed for batch processing. Familiarize yourself with your chosen software’s capabilities beforehand to optimize your workflow and verify accurate scale representation across your entire dataset.
Frequently Asked Questions
How Is a Scale Bar Used in Scientific Images?
You’ll use a scale bar in scientific images to provide size reference, allowing accurate measurement of structures. It helps you guarantee reproducibility, make precise comparisons, and effectively communicate dimensions in your research.
What Is the Scale Bar for 40X Magnification?
At 40x magnification, your scale bar converts at approximately 11.82 pixels per micrometer. You’ll need to multiply your desired measurement by this ratio to create an accurate scale bar for your images.
What Is the Scale Bar for 200X Magnification?
At 200x magnification, your scale bar typically represents about 100 microns, which is approximately 440 pixels in your image (using the standard 4.4 pixels per micron conversion ratio for this magnification).
How Do You Make a Scale for a Scientific Drawing?
You’ll need to determine the actual size of your subject, choose a consistent scale ratio, include a scale bar on your drawing, maintain accurate proportions, and document your scale in the caption or legend.
In Summary
You’ve now got the tools to create professional scale bars that guarantee your scientific images are properly calibrated and comparable. Remember, accurate scale representation isn’t just about aesthetics—it’s critical for scientific integrity. By mastering calibration, using ImageJ effectively, maintaining consistency, and implementing automated workflows, you’ll save time while producing publication-quality images that clearly communicate your research findings.
Leave a Reply