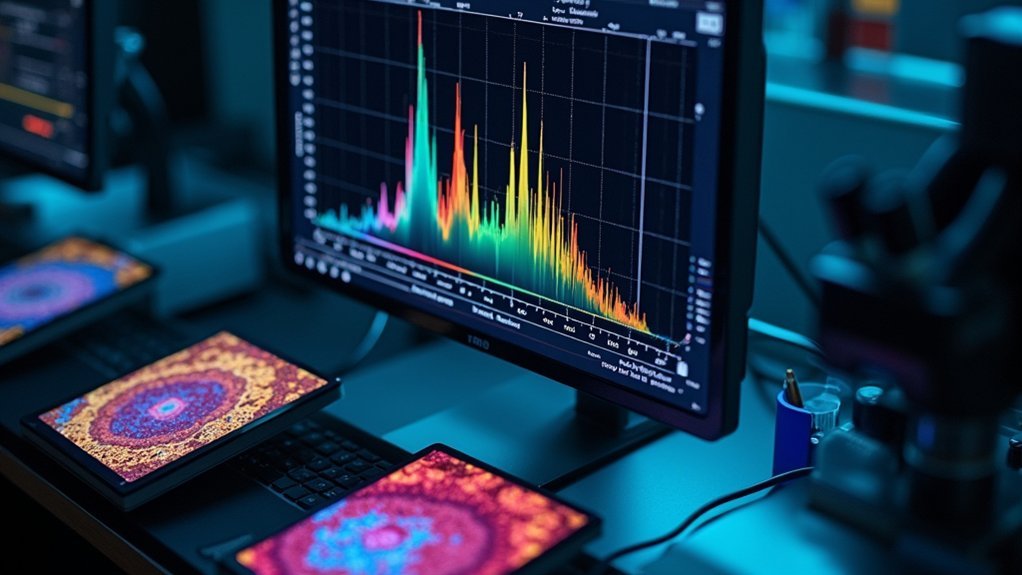
A microscope camera histogram shows how your image’s pixels are distributed across brightness levels (0-255). You’ll see a graph with peaks indicating where most pixels fall. Ideally, your histogram should span the full range without touching either edge—left crowding means underexposure, right crowding means overexposure. Different microscopy techniques produce distinct histogram patterns. Mastering these visual cues helps you capture excellent images with preserved details in both highlights and shadows.
NUMERIC LIST OF 13 SECOND-LEVEL HEADING(S)
Microscope camera histograms offer valuable insights across numerous aspects of image analysis and acquisition.
These powerful diagnostic tools help you maintain ideal image quality by visualizing your exposure distribution at a glance. When you’re working with microscopy images, understanding your histogram means you’ll capture all available detail in both shadows and highlights.
Histograms reveal your image’s full exposure story, ensuring you never miss critical details in scientific microscopy.
The histogram serves as your guide to adjust exposure settings in real-time, preventing clipped data that can’t be recovered later. You’ll want to see a smooth curve spanning the full brightness range from 0-255, with gentle tapering at both ends.
Watch for warning signs like gaps on the right side (underexposure) or abrupt cutoffs (overexposure), which indicate lost detail. Regular histogram analysis guarantees your microscope images accurately represent your specimens with maximum scientific value.
Understanding the Fundamentals of Microscope Camera Histograms
At the heart of effective microscope imaging lies the histogram—a graphical representation that maps the distribution of pixel brightness across your entire image. This powerful tool displays brightness values from 0 (black) to 255 (white) on the horizontal axis, while the vertical axis shows how many pixels exist at each brightness level.
When you’re evaluating your exposure, look for a histogram that spans the full brightness range without significant gaps or edge-crowding.
If your histogram shows peaks pressed against either edge, you’re losing valuable detail through underexposure or overexposure.
The Relationship Between Exposure and Pixel Distribution
In microscopy imaging, you’ll need to identify brightness peaks in your histogram to recognize where most image data concentrates, allowing you to make informed exposure adjustments.
You should carefully avoid clipping at either end of the histogram, as this permanently destroys valuable detail in shadows (left edge) or highlights (right edge) that can’t be recovered during post-processing.
To achieve ideal exposure, try making incremental adjustments to your camera settings while monitoring how the histogram shifts, aiming for a distribution that spans the full brightness range without touching the extreme edges.
Reading Brightness Peaks
How can you interpret those mountain-like formations on your microscope camera’s histogram? These peaks reveal essential information about your specimen’s brightness value distribution, helping you enhance your imaging.
| Peak Position | Meaning | Action Required |
|---|---|---|
| Left Edge | Underexposure | Increase exposure to retain shadow details |
| Center | Balanced exposure | Maintain settings for best detail |
| Right Edge | Overexposure | Reduce exposure to preserve highlights |
When your histogram shows a smooth curve centered in the middle with good spread, you’ve achieved balanced exposure. Watch for peaks touching either edge—they indicate detail loss in shadows or highlights. The ideal histogram displays brightness values across the full range without significant gaps. By learning to read these peaks, you’ll quickly identify exposure issues before they compromise your microscopy images.
Avoid Clipping Data
When your histogram shows pixel values stacked against either edge, you’re experiencing clipping – a significant issue that permanently destroys image data.
Left-edge stacking indicates lost shadow detail, while right-edge stacking means blown-out highlights.
A properly exposed image displays a histogram with gentle slopes on both sides, utilizing the full tonal range without touching the edges.
To preserve important microscopy details, aim to distribute your pixel values across the entire histogram without pushing them to extremes.
Your camera’s Highlight Alert feature can help identify clipped areas before you capture the image.
Monitor your histogram regularly during acquisition sessions to guarantee balanced pixel distribution.
Optimal Exposure Techniques
Understanding ideal exposure begins with grasping how your microscope camera translates light into numerical values across the histogram. Your goal is to capture the full dynamic range of your specimen by distributing pixels across the entire brightness spectrum without clipping.
When you adjust exposure time, you’re controlling where pixel data falls on the histogram. A properly exposed image shows a balanced distribution with minimal pixels touching either edge. This preserves both shadow and highlight details, giving you greater flexibility during analysis.
Consider using the ETTR technique—exposing to the right—where you maximize brightness without clipping highlights. This approach captures more tonal information and reduces noise in darker regions.
Identifying Ideal Histogram Patterns for Microscopy
What exactly makes a histogram “good” in microscope imaging? The ideal histogram displays a smooth curve spanning nearly the entire brightness range without being cut off at either end.
A well-balanced histogram reveals the complete story of your specimen’s brightness values, nothing hidden, nothing lost.
You’ll want to see most pixels concentrated in the middle with fewer pixels at the extremes, indicating balanced exposure that preserves details across the dynamic range.
When your histogram leans too far left, your image is underexposed, while a histogram cut off on the right signals overexposure—both scenarios result in lost image details.
A well-distributed histogram enhances signal-to-noise ratios, dramatically improving detail visibility, especially in brightfield microscopy.
Make histogram analysis a regular part of your image acquisition workflow. This simple habit helps you identify and correct exposure issues before capturing your final images, ensuring peak quality.
Common Histogram Issues in Brightfield Microscopy
Brightfield microscopy presents several characteristic histogram patterns that signal exposure problems you’ll need to recognize.
When your histogram shows a significant gap on the left side, you’re dealing with underexposure, where vital details in shadowed regions are lost. Conversely, a histogram with a truncated peak on the right indicates overexposure, compromising highlight details through clipping.
For best results, your histogram should display a smooth curve spanning a range of brightness values without excessive peaks at the edges. This balanced pixel distribution guarantees you’re capturing the full dynamic range of your specimen.
Remember that consistent lighting conditions and regular microscope calibration are essential for reliable histogram readings. Additionally, be mindful of the Nyquist criterion to avoid undersampling that can distort your histogram data and compromise image quality.
How to Recognize and Fix Underexposed Microscope Images
When examining your microscope images, you’ll immediately recognize underexposure by a histogram that’s heavily skewed to the left with a substantial gap on the right side. This gap indicates your sample’s brighter details aren’t being captured properly.
| Underexposure Sign | Solution |
|---|---|
| Right-side histogram gap | Increase exposure time |
| Dark, detail-poor image | Boost illumination intensity |
| Clumped left histogram | Guarantee 2/3 histogram utilization |
To fix underexposure, adjust your exposure settings to fill at least two-thirds of the histogram. Disable any automatic exposure adjustments that might be compensating for low light. The Highlight Alert feature can help you monitor potential clipping while making adjustments.
Regular calibration of your microscope’s lighting system prevents inconsistent exposures across imaging sessions, guaranteeing your histograms remain balanced and your specimens are accurately represented.
Managing Overexposure in High-Contrast Specimens
Unlike underexposure, overexposed microscope images reveal themselves through histograms that abruptly terminate at the right edge, creating a distinctive “wall” that signals lost highlight detail.
This clipping is particularly problematic with high-contrast specimens, where subtle structures in bright areas become permanently unrecoverable.
To preserve these critical details, adjust your exposure settings so the histogram spans the full brightness range without touching the right margin.
Enable your camera’s Highlight Alert feature to immediately identify overexposed regions during acquisition.
For challenging high-contrast specimens, switch to manual mode to maintain precise control over ISO, aperture, and shutter speed.
This prevents the camera from automatically overexposing bright areas.
Check your histogram frequently while imaging and make prompt adjustments to capture the specimen’s complete dynamic range.
Optimizing Dynamic Range for Different Specimen Types

Different specimen types demand tailored approaches to histogram optimization in microscopy imaging. For low-contrast specimens, increase exposure time or illumination to guarantee your histogram fills at least two-thirds of the dynamic range, revealing subtle details that might otherwise remain hidden.
With brightfield samples, aim for a right-aligned histogram that maximizes detail without oversaturating critical features.
- Regular calibration of light sources prevents uneven histograms and maintains consistent image quality
- White-referencing techniques correct for illumination inconsistencies, improving quantitative analysis
- Aim to fill 50-75% of your camera’s dynamic range without clipping highlights or shadows
Detecting Artifacts and Noise Through Histogram Analysis
Examining your histogram’s shape can reveal telltale signatures of noise when unexpected peaks or humps appear alongside your primary data distribution.
You’ll notice distinct patterns when contaminants like dust particles create small secondary bumps adjacent to your main histogram peak, compromising image clarity.
These artifact indicators help you determine whether your specimen requires cleaning or if your optical system needs maintenance before proceeding with image capture or analysis.
Noise Signature Recognition
When analyzing your microscope camera’s histogram, recognizing noise signatures becomes an essential skill for producing clean, accurate images.
You’ll notice that noise often creates distinctive peaks and valleys in your histogram, particularly small humps adjacent to the main data peak—these typically indicate dust or artifacts affecting your image quality.
Regular histogram analysis helps you:
- Identify anomalous noise patterns that reveal contamination or optical issues
- Distinguish between normal signal variation and problematic artifacts
- Monitor improvements after adjusting exposure and illumination settings
Contaminant Pattern Identification
Your microscope’s histogram serves as a powerful diagnostic tool for identifying contaminants and artifacts that might otherwise go unnoticed. When examining your histogram, look for unexpected peaks or humps adjacent to the main peak—these irregular features often reveal the presence of dust, bubbles, or optical imperfections.
An ideal background image displays a narrow, right-aligned histogram. If you notice deviations from this pattern, it’s time to evaluate your setup. Small spikes indicate specific artifacts requiring immediate attention, while broader distortions suggest more widespread contamination issues.
Regular maintenance, including thorough cleaning of slides and optical components, will greatly reduce these anomalies. Implementing proper white-referencing techniques further refines your histogram’s accuracy, ensuring reliable quantification.
Adjusting Camera Settings Based on Histogram Feedback
The histogram serves as a powerful visual guide for optimizing your microscope camera settings to achieve ideal exposure. By analyzing this graphical representation, you’ll quickly identify if your image is properly exposed or needs adjustment.
When your histogram shows data bunched to the left, you’re underexposing—increase exposure time or aperture size to correct this. If it’s skewed right with clipped highlights, reduce exposure or lower ISO settings.
- Use exposure compensation to fine-tune automatic settings while monitoring histogram changes
- Check the histogram during live imaging for real-time adjustments to maintain quality
- Aim for a smooth tapering curve at both ends of the histogram to preserve all image details
Making these adjustments guarantees your microscope images retain maximum detail in both shadows and highlights.
The Impact of Illumination Techniques on Histogram Patterns
When examining histogram patterns, you’ll notice significant differences between brightfield and darkfield microscopy, with brightfield typically showing a broader distribution while darkfield histograms cluster toward darker values with bright highlights.
The contrast between transmitted and epi-illumination also manifests in your histograms – transmitted light often produces more evenly distributed patterns, while epi-illumination may create more polarized brightness distributions depending on sample reflectivity.
You can use these distinctive histogram signatures to optimize your microscopy setup and guarantee you’re capturing the full dynamic range of your specimen.
Brightfield Vs Darkfield Patterns
Understanding how different microscopy illumination techniques affect histogram patterns can dramatically improve your ability to interpret image data.
When you examine a brightfield histogram, you’ll notice a wide distribution with peaks in the mid-tone range, indicating well-balanced contrast with consistent brightness across your sample.
Darkfield histograms tell a different story, appearing skewed toward the right with minimal values on the left, highlighting your specimen’s edges against a dark background.
- Brightfield images produce smoother histogram curves with balanced pixel distribution
- Darkfield patterns create sharp peaks at specific intensity levels, revealing fine details often missed in brightfield
- Overly reflective samples in brightfield can cause histogram clipping, while darkfield enhances feature differentiation
Trans Vs Epi-Illumination Effects
Choosing between transmitted and epi-illumination greatly alters your histogram patterns and reveals different aspects of your specimen. Transmitted illumination typically produces brighter histograms as light passes through your sample, while epifluorescence creates pronounced peaks at specific wavelengths where fluorescent markers emit light.
| Illumination Type | Histogram Characteristics | Exposure Considerations | Best Applications |
|---|---|---|---|
| Transmitted | Broader distribution | Avoid overexposure | General morphology |
| Epifluorescence | Sharp, defined peaks | Balance signal intensity | Specific structures |
| Combined | Complex patterns | Separate channel control | Correlative studies |
Your illumination choice directly impacts dynamic range – transmitted light requires careful exposure management to preserve details in bright regions, while epifluorescence demands fine-tuning to capture fluorescent signals without clipping highlights. The histogram serves as your guide to achieving best contrast regardless of illumination technique.
Histogram Differences Between Brightfield and Fluorescence Imaging
Brightfield and fluorescence imaging generate distinctly different histogram patterns that reflect their fundamental imaging principles. In brightfield, your histogram typically displays a smooth curve across the brightness range, indicating well-exposed samples. Fluorescence histograms, however, show distinctive peaks corresponding to specific emission wavelengths from your labeled components.
- Brightfield histograms reveal exposure quality through their distribution—gaps at edges signal under or overexposure.
- Fluorescence histograms help you identify signal saturation through sharp peaks that exceed your camera’s dynamic range.
- Background noise and autofluorescence appear as unwanted peaks in fluorescence histograms, while brightfield histograms remain largely unaffected by these factors.
When analyzing your histograms, aim for balanced distributions without clipping in brightfield and clear signal peaks without oversaturation in fluorescence to guarantee accurate quantification of your microscopy data.
Using Histograms for Consistent Multi-Sample Documentation
When documenting multiple samples across your research project, histograms become your quality control tool for maintaining consistent imaging conditions. By monitoring histogram distributions, you’ll quickly identify variations in lighting or exposure that could compromise your results.
| Histogram Feature | Importance for Multi-Sample Consistency |
|---|---|
| Distribution shape | Guarantees reproducible quantification across samples |
| Highlight clipping | Indicates overexposure requiring adjustment |
| Shadow detail | Reveals underexposure needing correction |
| Peak position | Confirms similar brightness levels between samples |
| Overall pattern | Validates consistent exposure conditions |
Pay attention to histogram similarities between samples to enhance experimental reproducibility. Using Highlight Alert alongside histogram analysis helps pinpoint overexposed areas that need correction. This approach minimizes the risk of signal saturation and maintains ideal signal-to-noise ratios, ultimately improving the reliability of your multi-sample documentation.
Frequently Asked Questions
How to Understand Camera Histogram?
A camera histogram shows your image’s brightness distribution. You’ll see a graph plotting pixel brightness from dark to light. Look for a balanced curve spread across the range to guarantee you haven’t lost detail in shadows or highlights.
What Does a Histogram Tell You About Your Photo?
A histogram shows you your photo’s exposure distribution. It tells you if your image has balanced brightness, clipped shadows or highlights, and helps you decide whether you’ll need to adjust exposure settings for better results.
What Does the Histogram of an Image Represent?
A histogram represents your image’s brightness distribution from dark (0) to light (255). It shows how many pixels exist at each brightness level, helping you identify whether you’ve properly exposed your shadows, midtones, and highlights.
What Does Correct Exposure Look Like on a Histogram?
A correctly exposed histogram spans the full brightness range with most pixels in the mid-tones. You’ll see a balanced distribution without clipping at edges, ensuring you’ve captured details in both shadows and highlights.
In Summary
You’ve now accessed the power of your microscope camera’s histogram as a diagnostic tool, not just a mysterious graph. By regularly consulting this visual representation of your image’s pixel distribution, you’ll capture better-exposed, more consistent micrographs. Remember, the histogram isn’t just indicating image quality—it’s guiding you toward ideal settings for your specific specimen and technique. Master it, and you’ll elevate your microscopy documentation to new levels.
Leave a Reply