A microscope camera histogram visually displays your image’s pixel brightness distribution from 0 (black) to 255 (white). You’ll see how many pixels occur at each brightness level, revealing if your image is underexposed (left-skewed), overexposed (right-skewed), or properly balanced (central peaks). When well-distributed, your histogram indicates ideal exposure that preserves both shadow and highlight details. Checking it regularly helps you make precise camera adjustments for better scientific imaging results. The patterns you notice can reveal much more about your specimen.
The Fundamentals of Microscope Camera Histograms
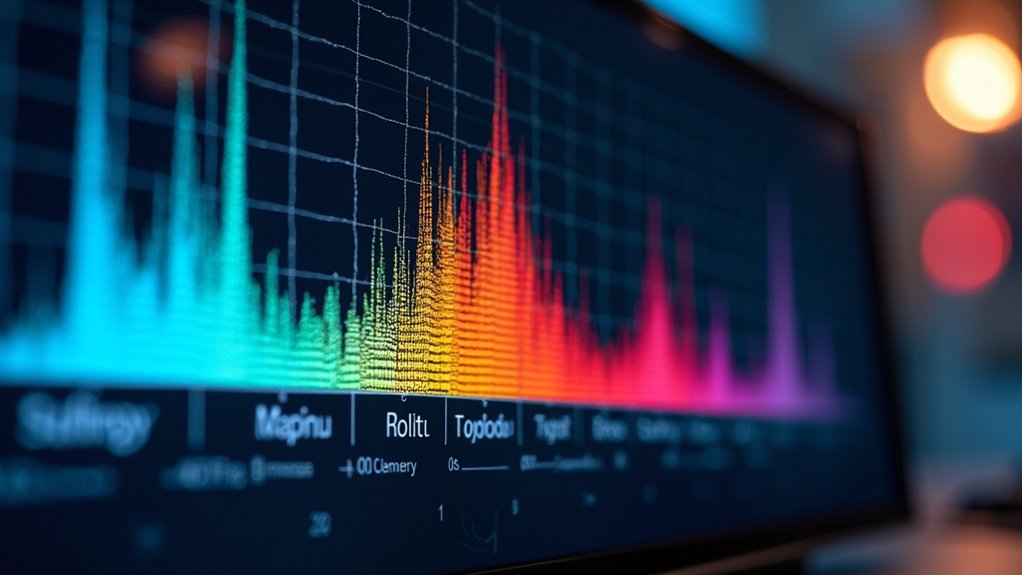
When you’re capturing microscope images, understanding the histogram is essential for achieving ideal results. This graphical representation displays your image data by plotting the distribution of pixel brightness values from black (0) to white (255). The height of each point indicates how many pixels share that particular brightness value.
A well-balanced histogram spans the full dynamic range, creating a smooth curve across the graph without abrupt cutoffs at either end.
If your histogram skews left, your image is underexposed, losing critical details in shadow areas. Conversely, a histogram clipped on the right indicates oversaturation and loss of highlight information.
Decoding Brightness and Pixel Distribution in Histograms
As you examine a microscope camera histogram, you’ll notice it reveals essential information about your image’s tonal distribution beyond simple exposure levels. The horizontal axis maps brightness values from 0 (black) to 255 (white), while the vertical axis shows how many pixels exist at each brightness level.
A well-balanced histogram displays a smooth curve spanning the entire brightness range without significant clipping at either end. When your histogram skews left, your specimen appears underexposed, with shadow details potentially lost. Conversely, a right-skewed histogram indicates overexposure, sacrificing highlight information.
For specimens with high dynamic range, you’ll want peaks distributed across the graph, ensuring both bright and dark areas retain detail.
Identifying Optimal Exposure for Scientific Imaging
When evaluating your microscope image quality, you’ll want to check that peak distributions in the histogram occupy the middle section without crowding either edge.
You can achieve ideal scientific imaging by ensuring your histogram avoids clipping at either end of the dynamic range, which would result in lost detail in shadows or highlights.
Careful analysis of your histogram’s shape will help you adjust exposure settings to capture the full range of specimen details without compromising data integrity.
Evaluating Peak Distribution
The histogram’s peak distribution serves as your visual guide to achieving perfect exposure in scientific imaging.
When analyzing your luminance histogram, pay attention to where the data concentrates—this reveals essential information about your specimen’s captured detail. A well-balanced digital camera image shows peaks distributed across the graph without clustering at either extreme.
If you notice peaks concentrated on the left side, you’re likely underexposing your sample, losing valuable shadow details. Increase your exposure time to shift the distribution rightward.
Conversely, peaks pushed against the right edge indicate overexposure, with highlight information potentially lost forever. The peaks and valleys should form a smooth curve spanning the tonal range while avoiding significant gaps.
Regular histogram evaluation during imaging sessions enables immediate adjustments for best scientific results.
Avoiding Dynamic Range Clipping
Dynamic range clipping occurs whenever important pixel information gets cut off at either end of your histogram, compromising your scientific image’s integrity. To prevent this, verify your histogram displays a balanced distribution that doesn’t collide with the 0 or 255 boundaries.
You’ll achieve ideal results when your histogram shows most pixels concentrated in the midtones with a gentle tapering toward both ends. This indicates you’ve captured the full dynamic range of your specimen without losing detail in shadows or highlights.
During acquisition, continuously monitor your histogram and adjust exposure time, illumination intensity, or gain settings when you notice the curve pushing against either edge.
Use exposure compensation to fine-tune automatic settings whenever necessary. This vigilance guarantees your scientific images retain maximum information for accurate analysis and interpretation.
Common Histogram Patterns in Brightfield Microscopy
Understanding common histogram patterns in brightfield microscopy helps you interpret image quality instantly.
When examining your histogram, look for a distribution that spans the full brightness range with gentle tapering at both ends—this indicates proper exposure with minimal clipping.
If you notice peaks clustered on the left side, your image is underexposed, sacrificing detail in darker regions.
Conversely, when the histogram shows an abrupt cut-off on the right, you’re dealing with overexposure and lost highlight information.
For background images, aim for a narrow, right-aligned histogram without reaching saturation.
Monitor your histogram regularly during sessions to catch illumination problems early.
You’ll want to utilize 50-75% of your camera’s dynamic range to maintain ideal exposure while avoiding saturation issues that compromise image quality.
Troubleshooting Exposure Issues Using Histogram Analysis
You’ll quickly identify overexposure when your histogram appears clipped on the right side, often confirmed by the Highlight Alert function showing bright areas where detail has been lost.
To fix dark image issues where the histogram bunches on the left, increase your exposure time or adjust your microscope’s illumination intensity until the graph shifts toward the center.
Check your adjusted exposure by confirming the histogram spreads across the brightness range without touching either edge, ensuring you’ve captured all available detail in both shadows and highlights.
Overexposure Detection Methods
When analyzing microscope images, recognizing overexposure quickly becomes essential for capturing usable scientific data. Your first line of defense is the histogram—watch for that telltale cut-off peak on the right side, which indicates you’ve exceeded maximum brightness levels and lost critical detail in your specimen’s highlights.
Enable your camera’s Highlight Alert feature to visually mark clipped areas, making overexposure immediately apparent during live viewing. If you notice these warning signs, reduce your light level or shorten exposure time to bring those bright details back into range.
A properly exposed image displays a histogram with smooth tapering at both edges rather than hard collisions with either boundary.
Fixing Dark Image Issues
Just as overexposure ruins data by clipping highlights, dark microscope images present their own analytical challenges.
When your histogram shows a significant gap on the right side, you’re losing valuable highlight details due to underexposure.
To fix this issue, increase your exposure time or boost illumination until the histogram fills at least two-thirds of the available range. Aim to shift the peak closer to the right without reaching the edge where clipping occurs. Your Highlight Alert feature can help identify areas approaching overexposure during these adjustments.
If your histogram consistently indicates insufficient light despite adjustments, check your light source and optimize camera settings like ISO and shutter speed.
Regular microscope calibration guarantees consistent illumination across samples, preventing dark images caused by uneven lighting conditions.
Adjusting Camera Settings Based on Histogram Feedback
The histogram serves as your visual guide to achieving ideal exposure in microscopy imaging. When you notice your histogram isn’t utilizing the full brightness range, adjust your camera settings accordingly. This real-time feedback helps you enhance exposure before capturing your final image.
| Histogram Pattern | Issue | Adjustment |
|---|---|---|
| Left-skewed | Underexposed image | Increase exposure time or ISO |
| Right-skewed | Overexposed image | Decrease exposure time or ISO |
| Clipped at edges | Lost detail | Use exposure compensation |
Check your histogram regularly while making adjustments. If you’re photographing high-contrast specimens, aim for a centrally-peaked distribution to maintain details in both shadows and highlights. When the histogram shows an even distribution across the range without touching the edges, you’ve achieved ideal exposure for your microscopy specimen.
Histogram Interpretation for Different Microscopy Techniques
Different microscopy techniques produce distinctive histogram patterns that require specific interpretation approaches. When analyzing your microscope camera’s histogram, you’ll need to understand how brightness values and pixel count distributions vary across methods.
- Brightfield microscopy typically shows a bell-shaped histogram with most pixels in the mid-range, where you’ll want to verify the curve doesn’t clip at either end.
- Fluorescence microscopy often displays peaks skewed toward darker values with small brightness spikes, requiring careful exposure to preserve signal integrity.
- Phase contrast generates distinctive bimodal histograms, where maintaining separation between the two peaks is essential for ideal contrast.
- DIC (Differential Interference Contrast) histograms show gradual slopes across brightness values, where image processing adjustments should maintain the subtle gradients that reveal sample topography.
Using Histograms to Enhance Image Quality and Data Accuracy
When properly leveraged, microscope camera histograms become powerful tools for optimizing image quality and ensuring data integrity. By monitoring histograms during image acquisition, you’ll gain real-time insights to adjust exposure settings before problems occur.
A well-distributed histogram that spans the entire brightness range helps preserve critical details in both highlights and shadows.
The Highlight Alert feature works alongside your histogram to identify areas that might be overexposed, allowing you to make necessary corrections immediately.
Never miss critical details with Highlight Alert—your visual guardian against data-compromising overexposure in microscopy imaging.
Pay attention to histogram peaks and gaps—they reveal opportunities to refine lighting conditions for better results.
Regularly analyzing these distributions will help you develop more consistent imaging techniques and improve the reproducibility of your microscopy studies, ultimately leading to more accurate and reliable data.
Advanced Histogram Analysis for Specialized Microscopy Applications
Specialized microscopy applications demand a more sophisticated approach to histogram analysis than standard brightfield imaging.
When you see a histogram in fluorescence or phase contrast microscopy, you’re viewing a critical diagnostic tool that reveals the distribution of intensity values across your digital image.
For advanced applications, consider these processing techniques:
- Monitor RGB channel histograms separately when working with fluorescence to prevent channel-specific clipping.
- Implement logarithmic scaling for high dynamic range samples to visualize both dim and bright structures.
- Use histogram equalization selectively for enhancing low-contrast features in tissue samples.
- Apply real-time histogram feedback to optimize exposure settings for live cell imaging, ensuring critical signals aren’t lost to underexposure or saturation.
Frequently Asked Questions
How to Understand Camera Histogram?
A camera histogram shows how many pixels fall at each brightness level. You’ll see a graph from black (left) to white (right). It’s your quickest way to check if exposure’s balanced, not too dark or bright.
What Does a Histogram Tell You About Your Photo?
A histogram shows you how light and dark values are distributed in your photo. It’ll tell you if you’ve lost detail in shadows or highlights, helping you adjust exposure for better image quality.
What Does the Histogram of an Image Represent?
A histogram represents your image’s brightness distribution, showing how many pixels exist at each brightness level from black (0) to white (255). It helps you identify exposure issues and understand your photo’s tonal range.
What Does Correct Exposure Look Like on a Histogram?
Correct exposure on your histogram shows data spanning the full range without clipping at edges. You’ll see most pixels in the middle with smooth tapers on both ends, indicating balanced brightness and preserved details.
In Summary
Your microscope camera histogram is a powerful quality control tool. It’s showing you the distribution of pixel brightness values across your image. By learning to read it correctly, you’ll avoid overexposure, underexposure, and capture more accurate data. Take time to understand your histogram patterns for different samples and techniques—you’re not just improving image aesthetics, you’re enhancing the scientific validity of your microscopy work.
Leave a Reply