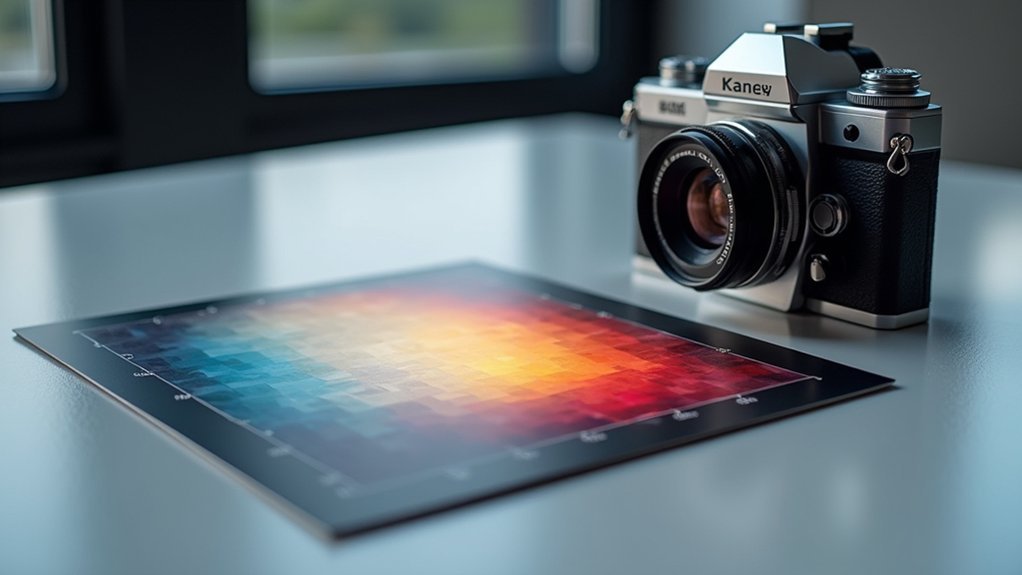
Camera exposure charts are critical for your scientific imaging because they guarantee quantitative data accuracy. They help you maximize dynamic range while preventing pixel saturation that would compromise analysis. By standardizing exposure times across samples, you’ll achieve valid comparisons between control and experimental conditions. You’ll also balance signal-to-noise ratio effectively, capturing subtle variations in specimen brightness. Proper exposure management transforms imaging from subjective guesswork into precise science – the foundation for trustworthy research conclusions.
Why Camera Exposure Charts Matter For Scientific Imaging
While many researchers focus on sample preparation and experimental design, camera exposure settings often determine whether your imaging data will be scientifically valuable or fundamentally flawed.
Camera exposure charts provide essential guidelines for enhancing the balance between exposure time and gain settings, directly impacting your image quality and experimental outcomes.
These charts help you quickly identify the appropriate exposure time based on your sample’s brightest expected signal, eliminating wasteful trial and error. By following established exposure parameters, you’ll maximize your camera’s dynamic range while maintaining consistent image quality across experiments.
This consistency becomes vital when comparing treated samples against controls, ensuring reliable data interpretation. For live-cell imaging, where minimizing light exposure preserves cell health, these charts become even more valuable by helping you capture clear images with ideal signal-to-noise ratios.
The Fundamentals of Exposure in Microscope Photography
The fundamentals of microscope photography hinge on your ability to find perfect exposure—the delicate balance between light intensity and exposure time that reveals specimen details with clarity.
You’ll achieve ideal results when you carefully balance your signal-to-noise ratio, allowing sufficient light capture while minimizing electronic and photonic noise that degrades image quality.
Understanding characteristic curves and exposure latitude for your specific camera system lets you predict how adjustments will affect your final image, ensuring you capture scientifically valuable data rather than just visually appealing pictures.
Finding Perfect Exposure
Three critical factors govern perfect exposure in microscope photography: light intensity, exposure time, and the specimen’s optical properties. You’ll need to balance these variables using the exposure equation (E = I × t) to achieve proper exposure without oversaturation.
| Specimen Type | Recommended Exposure Time | Light Intensity Setting |
|---|---|---|
| Brightfield | 1/60 – 1/15 sec | 50-75% maximum |
| Darkfield | 1/15 – 1/2 sec | 75-100% maximum |
| Fluorescence | 1-10 sec | Minimum necessary |
| Phase Contrast | 1/30 – 1/8 sec | 60-80% maximum |
| Polarized | 1/20 – 1/4 sec | 70-90% maximum |
When working with transparent specimens, you’ll need shorter exposure times with increased light intensity. Remember that negative films handle overexposure better than transparencies. Consider bracketing your exposures when working with high-contrast specimens to find the perfect balance.
Signal-to-Noise Ratio Balancing
Understanding signal-to-noise ratio (SNR) forms the backbone of successful scientific microscope photography. When you capture microscope images, your SNR (defined as Signal/Effective Noise) directly impacts image quality and data accuracy.
You’ll achieve higher SNR through longer exposure time, which allows more photons to reach your sensor, strengthening your signal against the constant backdrop of noise. However, you must balance this carefully—excessive exposure time leads to pixel saturation and detail loss, ultimately reducing your effective SNR.
Remember that effective noise includes dark noise, shot noise, and read noise—all influenced by your exposure settings. By thoughtfully adjusting exposure time and gain, you’ll optimize SNR for your specific imaging tasks.
This balance is particularly vital when capturing faint signals that might otherwise be lost in the noise floor of your imaging system.
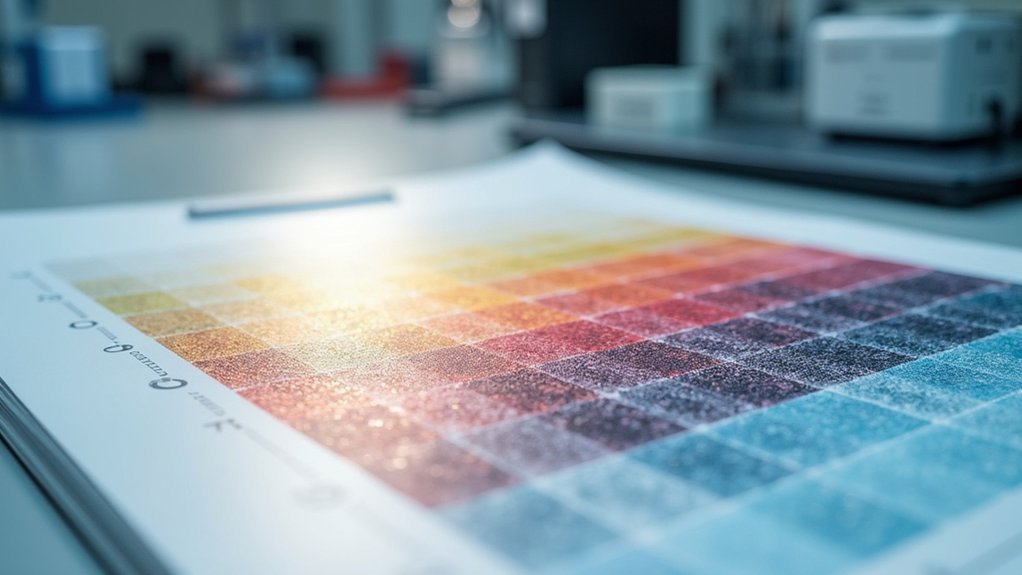
Dynamic Range Optimization With Exposure Charts
While many researchers struggle with capturing both bright and dim features in a single image, exposure charts provide a systematic approach to maximize your camera’s dynamic range capabilities. By mapping the relationship between exposure time and sensor response, you’ll identify the ideal settings before saturation of pixels occurs.
When you’re optimizing dynamic range with exposure charts, you’ll:
- Determine the longest viable exposure time that captures dim features without losing detail in bright regions
- Compare samples accurately by establishing standardized exposure parameters for control and experimental groups
- Enhance your signal-to-noise ratio by selecting exposure settings that reveal subtle variations in specimen brightness
You’ll find that proper chart utilization transforms your imaging from guesswork into a precise science, ensuring your results accurately represent the biological reality you’re investigating.
Signal-to-Noise Ratio and Exposure Relationships
Since image quality fundamentally depends on signal-to-noise ratio (SNR), mastering exposure settings becomes essential for scientific accuracy.
Image quality hinges on SNR—master your exposure settings to ensure scientific integrity.
You’ll find that longer exposure times directly impact your SNR by increasing the photon count relative to inherent camera noise.
When you’re examining faint specimens, inadequate exposure time results in images where noise obscures significant details. Your effective noise (σEFF = √(Dark noise + Shot noise + Read noise)) decreases proportionally as signal strength increases, making proper exposure vital.
Using exposure charts helps you identify the ideal balance—too short an exposure produces noisy images, while excessively long exposures risk saturation.
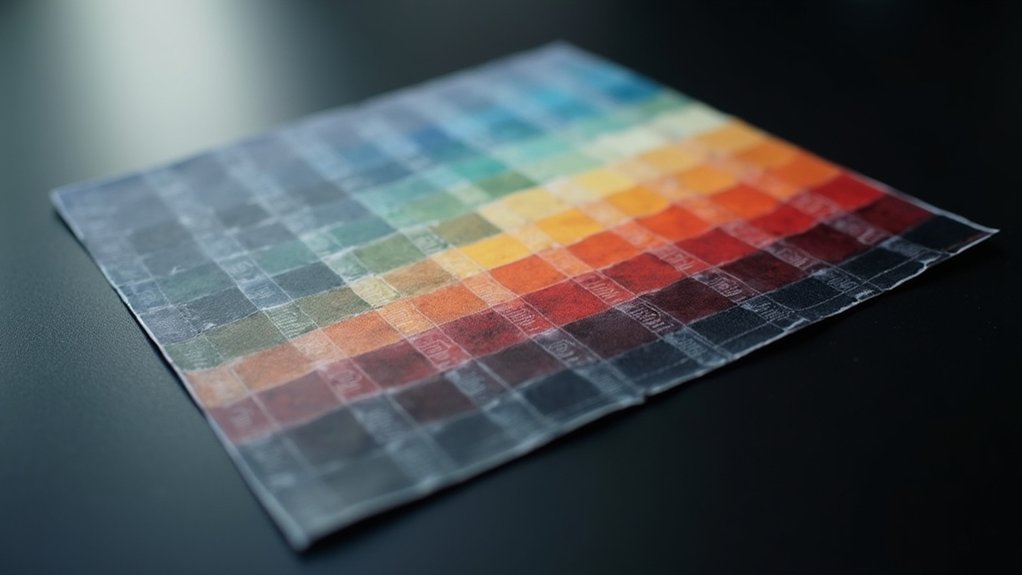
Preventing Pixel Saturation in Scientific Imaging
Preventing pixel saturation guarantees you’ll maintain signal integrity in your scientific images by capturing all intensity values within the detector’s dynamic range.
You can optimize your camera’s dynamic range by carefully selecting exposure times based on the brightest regions of your specimen and consulting exposure charts designed for your specific imaging application.
When you keep pixels below saturation thresholds, you’ll preserve quantitative accuracy in your data, allowing for reliable analysis and comparison across multiple samples or time points.
Signal Integrity Preservation
Because scientific imaging demands absolute data accuracy, maintaining signal integrity through proper exposure control is non-negotiable.
You’ll need to optimize exposure time carefully—aim for the longest possible duration without reaching pixel saturation to maximize your signal-to-noise ratio while preserving data integrity.
When comparing treatment groups with controls, consistent exposure settings guarantee reliable intensity measurements.
Use your imaging software to monitor pixel intensity levels in real-time by:
- Checking histogram distributions to verify values remain below saturation thresholds
- Establishing exposure protocols that utilize 70-80% of your camera’s dynamic range
- Implementing validation steps to confirm signal linearity across your experimental conditions
Dynamic Range Optimization
To capture the complete intensity spectrum your samples offer, you’ll need to master dynamic range optimization—the delicate balance between extracting maximum signal detail while avoiding pixel saturation.
By extending exposure time appropriately, you’ll enhance pixel intensity and reveal subtle variations in your sample’s signal strength that might otherwise remain hidden.
When imaging groups of samples, always set your exposure based on the brightest expected signal. This prevents data loss through saturation while maintaining the integrity of your quantitative analysis.
Use your imaging software’s histogram function to monitor pixel intensity distribution in real-time, ensuring you’re utilizing your camera’s full dynamic range without clipping.
Quantitative Data Accuracy
When pixels reach their maximum intensity value, they become saturated—a critical problem that compromises your quantitative analysis and renders your data scientifically meaningless.
To maintain accurate intensity comparisons between treated and control samples, you must carefully adjust exposure time based on the brightest expected signal.
Camera exposure charts help you optimize your imaging by:
- Preventing signal clipping that occurs when bright pixels exceed your camera’s dynamic range
- Ensuring consistent exposure times across all samples for valid comparative analysis
- Balancing longer exposures for better signal-to-noise ratio while avoiding saturation
Monitor pixel intensity through your imaging software to confirm you’re capturing the full range of signal without saturation.
Remember that proper exposure settings preserve the true characteristics of your sample, allowing for reliable quantification and meaningful scientific conclusions.
Exposure Compensation Techniques for Varied Specimen Types
Scientific imaging demands precise exposure adjustments since each specimen presents unique optical properties that can dramatically affect image quality. You’ll need to master exposure compensation techniques to capture ideal detail in your varied samples. For dark specimens, increase exposure time while maintaining appropriate film speed; for bright specimens, reduce exposure to prevent data loss through saturation.
| Specimen Type | Exposure Adjustment | Consideration |
|---|---|---|
| Dark/Opaque | Longer exposure | Signal clarity |
| Bright/Translucent | Shorter exposure | Prevent clipping |
| Live Cells | Minimal exposure | Reduce phototoxicity |
When adjusting your settings, consult characteristic curves specific to your imaging system. Use light meters and histogram analysis to evaluate exposure in real-time, allowing you to make precise adjustments based on each specimen’s unique optical properties rather than relying on generic settings.
Comparing Intensities Between Control and Experimental Samples
Accurate comparisons between control and experimental samples depend entirely on consistent exposure settings across all images.
When capturing intensity values, you must set your exposure time based on the brightest expected signal to prevent pixel saturation. This consistency guarantees you’re examining actual biological differences rather than imaging artifacts.
Select the longest non-saturating exposure time to maximize your camera’s dynamic range, providing more accurate measurements for both samples.
Remember to:
- Monitor histograms during acquisition to verify signals remain within measurable range
- Maintain identical exposure times between control and experimental groups, even if one appears dimmer
- Consider noise components (dark noise, shot noise) when evaluating signal-to-noise ratios
Special Considerations for Live-Cell Microscopy Exposure
Unlike fixed specimens, live cells require considerably different exposure strategies to maintain their viability throughout imaging sessions.
You’ll need to minimize exposure time to prevent photodamage while still capturing essential cellular details. This delicate balance often requires trial and error.
When configuring your microscope settings, aim for the shortest possible exposure time that still yields meaningful data.
Monitor pixel intensity carefully to utilize the full dynamic range without reaching saturation, which can damage cells and compromise data quality.
Remember to maintain consistent imaging conditions between your control and experimental samples.
By carefully balancing light intensity and exposure duration, you’ll protect cell health while collecting reliable data.
Your exposure charts should reflect these special considerations, documenting the best parameters you’ve established for each live-cell experiment.
Balancing Image Quality and Cellular Health in Long-Term Studies
When conducting long-term live-cell imaging studies, you’ll face the fundamental challenge of maintaining cellular viability while still acquiring high-quality images. Shorter exposure times are vital to minimize photo-toxicity, even if this means sacrificing some image intensity.
You’ll need to determine ideal exposure settings through methodical testing that prioritizes cellular health.
Consider these important factors:
- Aim for a signal-to-noise ratio that reveals necessary details without excessive light exposure
- Monitor pixel intensity regularly to prevent oversaturation that damages cellular structures
- Maintain consistent exposure times throughout your study to guarantee valid comparisons between timepoints
Remember that maintaining stable imaging conditions is essential for accurately interpreting cellular responses over time. Your exposure charts should reflect this balance, documenting settings that preserve both data integrity and biological relevance.
Camera Sensor Technology and Its Impact on Exposure Settings
The technical specifications of your camera sensor form the foundation of effective exposure management in scientific imaging. When working with scientific-grade cameras like the ASI2600, understanding how the 16-bit ADC operates below unity gain directly affects your dynamic range and noise profile.
Your selection of exposure time must align with your sensor’s well depth to prevent pixel intensity clipping. Higher gain settings increase light sensitivity but introduce more read noise, requiring a calculated balance for optimal signal-to-noise ratio.
Maintaining sensor temperature below 10°C is essential for reducing thermal noise during long exposures. For reliable data collection, always tailor your exposure parameters to your specific sensor’s characteristics.
This approach guarantees you’re capturing the full dynamic range while minimizing noise contamination in your scientific imaging work.
Standardizing Exposure Parameters Across Multiple Experiments
Scientific rigor demands consistent exposure parameters across your experimental series to guarantee reliable data interpretation. When you standardize exposure settings, you’ll minimize variations that could otherwise skew your results when comparing treated and control samples.
Camera exposure charts serve as valuable tools that help you:
- Determine ideal exposure times based on sample luminance, ensuring accuracy between imaging sessions
- Identify the longest exposure that avoids pixel saturation, utilizing the full dynamic range of your camera
- Reduce trial-and-error optimization, creating more efficient experimental workflows
Effective Noise Management Through Proper Exposure
Three primary noise sources—dark noise, shot noise, and read noise—collectively determine your imaging system’s signal quality. Understanding how these combine into effective noise (σEFF) is essential for optimizing your experimental conditions.
Longer exposure time directly impacts your signal-to-noise ratio by increasing photon collection. You’ll achieve better results by extending exposure until you’re just below saturation for the brightest areas of your sample. This approach maximizes your camera’s dynamic range utilization.
Monitor your pixel intensity during imaging sessions to guarantee you’re capturing the full dynamic range without saturation. By adjusting exposure time based on the brightest expected signal, you’ll minimize effective noise across your images.
This systematic approach guarantees consistent image quality and reliable quantitative analysis across multiple experiments.
Frequently Asked Questions
Why Is Camera Exposure Important?
Camera exposure is important because it guarantees you’re capturing high-quality images with ideal brightness and detail. It maximizes your dynamic range, improves signal-to-noise ratio, and helps you maintain consistency across multiple scientific samples.
What Determines the Correct Exposure Time Needed to Take a Digital Image?
You’ll determine correct exposure time by balancing light intensity with exposure duration needed for ideal pixel values. You’re aiming for sufficient brightness without saturation, adjusting based on your sample’s brightness and imaging goals.
Why Does Exposure Triangle Matter in Photography?
The exposure triangle matters because it gives you control over your photos. You’ll balance aperture, shutter speed, and ISO to achieve proper exposure while manipulating depth of field, motion blur, and noise levels.
Why Is It Important to Consider Digital Camera Exposure and Shutter Speed?
You’ll need to control exposure and shutter speed to balance light, prevent motion blur, and maximize image quality. They affect your ability to capture clear details and maintain proper dynamic range.
In Summary
You’ll find exposure charts indispensable for scientific imaging success. They’re your roadmap to optimizing dynamic range, managing signal-to-noise ratios, and preventing data loss through pixel saturation. By mastering exposure fundamentals, you’re not just capturing images—you’re ensuring experimental reproducibility and data integrity. Whether you’re working with live cells or fixed specimens, proper exposure control remains your key to reliable, quantifiable scientific results.
Leave a Reply