When analyzing polarized images, you’ll need to properly calibrate your system first and understand the Stokes parameters (S₀-S₃). Guarantee correct alignment of polarizers at 90° angles, select appropriate light sources, and prepare thin, uniform samples free of bubbles. Use the Michel-Levy chart to interpret interference colors, document all settings for reproducibility, and implement real-time averaging to reduce noise. Master these fundamentals and you’ll reveal powerful insights into material structure and stress patterns.
10 Essential Tips for Analyzing Polarized Images

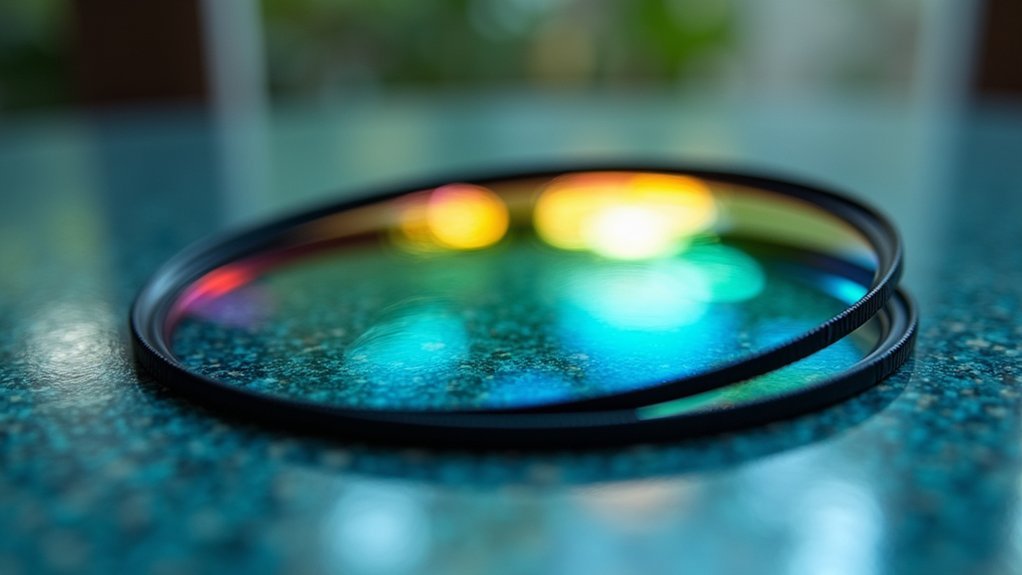
When setting up your polarized imaging system, ensuring proper alignment of polarizers and analyzers is essential to success. Always verify their orientation before capturing images to optimize the visibility of birefringent structures.
Remember that Malus’ Law helps you predict intensity changes as you rotate your polarization filters—this knowledge is invaluable when interpreting results.
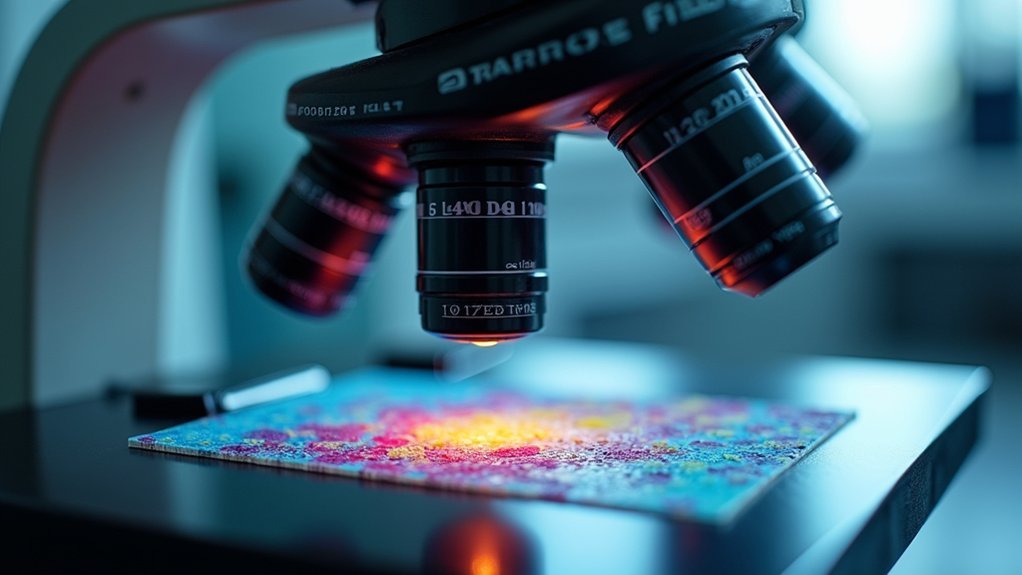
Pay close attention to color variations in your polarized light microscopy images, as they reveal critical information about stress distribution and structural characteristics.
The Michel-Levy chart will help you accurately assess birefringence and specimen thickness based on interference colors.
You’ll get the most informative results by documenting how different angles between polarization states affect feature visibility. This systematic approach allows you to better understand and analyze the polarized images you capture.
Understanding the Stokes Parameters in Polarization Analysis
To fully characterize polarized light in your imaging applications, you’ll need to master the Stokes parameters, a powerful mathematical framework that completely describes polarization states.
The four Stokes parameters (S₀, S₁, S₂, S₃) provide a complete mathematical representation of light’s polarization state, with S₀ representing total intensity while the others quantify different polarization components.
The Stokes parameters form a complete mathematical framework for polarization, with S₀ measuring intensity while S₁, S₂, and S₃ capture distinct polarization components.
- S₀ measures the total light intensity regardless of polarization
- S₁ differentiates between horizontal and vertical linear polarization
- S₂ represents the difference between 45° and 135° linear polarization
- S₃ quantifies circular polarization (right-handed vs. left-handed)
Extract these parameters by taking at least four intensity measurements at different polarization orientations.
The resulting Stokes vector can be visualized on the Poincaré sphere, giving you intuitive insight into complex polarization states.
Proper Calibration of Your Polarizing Microscope
Precise calibration of your polarizing microscope forms the foundation of reliable polarized image analysis.
Start by verifying that your first polarizer correctly transmits light in a specific plane before introducing specimens. Use a calibrated stage to position your sample, seeking the “dark position” where minimal light passes when the analyzer crosses the polarizer.
Check your polarizers regularly for misalignment or degradation, as even slight deviations dramatically affect image quality. The polarization of light must remain consistent throughout your observations.
Establish measurement accuracy by calibrating with known birefringent standards. This creates a reliable baseline for all subsequent analyses.
Document all settings and configurations meticulously after each session. This practice guarantees reproducibility and enables meaningful comparisons between different imaging experiments.
Optimal Illumination Techniques for Polarized Specimens
Achieving superior polarized image quality hinges on your illumination choices. Your results depend on strategically manipulating light to reveal a specimen’s birefringent properties. Select a coherent light source like lasers or LED arrays to maintain consistent polarization across samples.
- Adjust your first polarizer’s angle to improve contrast and highlight specific features.
- Position a condenser lens to focus polarized light, enhancing illumination uniformity.
- Add a neutral density filter to control light intensity while reducing glare.
- Experiment with different distances between light source and specimen for best results.
- Confirm your illumination setup complements the specific characteristics of your polarized material.
These techniques will greatly enhance your ability to detect subtle details and structural variations within polarized specimens, leading to more accurate analysis and interpretation.
Interpreting Birefringence Patterns and Color Effects

When you’re examining birefringent specimens, the vivid interference colors reveal critical information about material thickness, orientation, and composition through the Michel-Levy chart.
You’ll notice that different colors correspond to specific phase differences between ordinary and extraordinary rays, allowing you to map crystal orientations with precision.
These color patterns change as you rotate the specimen between crossed polarizers, providing valuable insights into structural arrangements and internal stresses that wouldn’t be visible with conventional microscopy.
Decoding Interference Colors
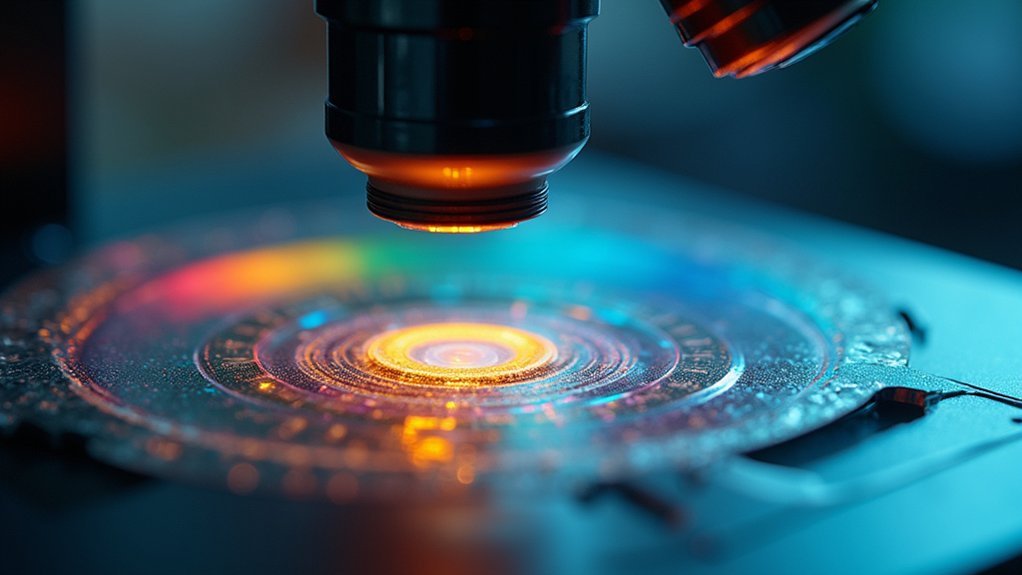
The mesmerizing rainbow of colors that appears in polarized images reveals critical information about the material under examination. When you observe these interference colors through a polarization microscope, you’re actually seeing the phase difference between two polarized light rays interacting with birefringent materials.
The Michel-Levy interference color chart helps you translate these colors into quantitative measurements of thickness and stress distribution.
- Look for color changes that indicate variations in material thickness
- Match observed colors with the Michel-Levy chart to determine precise measurements
- Note how optical anisotropy creates predictable color sequences as thickness increases
- Use color variations to identify areas of internal stress within your specimen
- Compare unexpected color patterns to standard references to detect structural anomalies
Crystal Orientation Mapping
Mapping crystal orientation through polarized microscopy reveals the hidden architecture of crystalline materials by translating birefringence patterns into precise structural data.
When you position your birefringent material under a polarizing microscope, you’ll notice interference colors change as you rotate the specimen. These color variations aren’t random—they directly correspond to how crystal axes align with your polarized light direction.
To accurately map orientations, you’ll need to correlate observed colors with the Michel-Levy chart, considering both specimen thickness and refractive indices.
For best results, adjust your polarizing microscope so that crossed polarizers create maximum contrast when the crystal’s optical axis aligns with the analyzer. This technique allows you to detect subtle variations in crystal orientation, revealing stress patterns and structural integrity that would otherwise remain invisible under conventional microscopy.
Digital Processing Methods for Polarized Light Images
Processing polarized light images effectively requires sophisticated digital methods that extract valuable information from raw data. You’ll need to apply algorithms that enhance contrast by manipulating Stokes parameters while implementing background subtraction and noise reduction techniques.
Your digital processing workflow should include calibration to guarantee accurate representation of polarization states in your samples.
- Use histogram equalization to improve visibility of subtle birefringent features
- Apply machine learning algorithms to automatically classify different polarization states
- Incorporate color channel analysis to differentiate wavelength-dependent responses
- Implement image segmentation to isolate and quantify structural characteristics
- Utilize background subtraction techniques to remove unwanted artifacts that obscure important details
These methods will transform your raw polarized light images into meaningful data that reveals otherwise invisible material properties.
Avoiding Common Artifacts in Polarized Microscopy
While digital processing enhances polarized images, even the most sophisticated algorithms can’t rescue data corrupted by fundamental artifacts. You’ll need to address issues at their source during polarized microscopy sessions.
| Artifact Type | Prevention Method | Impact | Importance |
|---|---|---|---|
| Misalignment | Cross polarizers at exactly 90° | False birefringence | Critical |
| Contamination | Clean optical components regularly | Interference patterns | High |
| Light fluctuation | Use stabilized light source | Inconsistent colors | Medium |
| Uncalibrated filters | Apply standardized polarizing filters | Misleading intensity | High |
When interpreting birefringence, consult the Michel-Levy chart to accurately identify materials based on interference colors. Remember that artifacts aren’t just annoyances—they fundamentally alter your data interpretation. Your careful attention to these technical details will dramatically improve the reliability of your polarized microscopy results.
Quantitative Analysis of Polarization Data
Unlike qualitative inspection, quantitative analysis of polarization data transforms your microscopy results into precise measurements that can be statistically evaluated. To extract meaningful metrics from your polarized images, you’ll need to measure Stokes parameters (S_0, S_1, S_2, S_3), which fully characterize the polarization state of light.
Move beyond subjective observations by converting polarization data into quantifiable metrics through Stokes parameters measurement.
- Collect at least four intensity measurements at different polarization angles (0°, 90°, 45°, 135°) to reconstruct the complete Stokes vector.
- Apply non-linear least-squares fitting during calibration to determine azimuth angle and effective retardance.
- Aim for ideal phase delays (76°-90°) to improve your measurement matrix’s condition number.
- Reduce noise through real-time averaging of multiple captured frames.
- Use Stokes polarimetry techniques to thoroughly analyze the polarization characteristics of your samples.
Sample Preparation Strategies for Enhanced Contrast

Ideal mounting techniques directly impact the quality of your polarized images by minimizing artifacts and enhancing structural contrast.
You’ll need to select buffers that maintain sample integrity while avoiding solutions that alter polarization properties or introduce unwanted birefringence.
When you match your mounting medium’s refractive index to your specimen, you’ll greatly reduce light scattering and improve the visibility of anisotropic features.
Mounting Techniques Matter
Successful polarized image analysis depends greatly on how you prepare and mount your samples. The right mounting techniques guarantee your specimens remain stable and properly oriented during polarized light microscopy, directly impacting image quality.
When mounting samples, use adhesive mounting methods that won’t interfere with the optical properties or introduce unwanted birefringent effects.
- Cut thin, uniform sections to minimize light scattering and enhance contrast
- Select immersion media with matching refractive indices to reduce reflections
- Verify your samples are completely free of air bubbles and dust particles
- Use mounting adhesives that don’t alter polarization states
- Position your sample in the ideal orientation to highlight the birefringent properties you’re studying
These careful mounting practices will considerably improve your polarized light microscopy results.
Buffer Selection Considerations
Selecting appropriate buffers represents a critical step in polarized image analysis that directly impacts contrast and accuracy of results.
You’ll want to choose buffers that minimize birefringence to prevent artifacts from distorting your polarization data.
Phosphate-buffered saline (PBS) offers a reliable option, maintaining stable pH and ionic strength while promoting imaging clarity.
Match the buffer’s refractive index closely to your sample’s to reduce unwanted light refraction that can interfere with polarization effects.
Consider using low-viscosity buffer compositions to enhance polarized light penetration, improving interaction with your sample and enhancing contrast.
Before finalizing your protocol, conduct preliminary tests with different buffers to determine which combination yields ideal contrast with minimal interference for your specific sample type.
Cross-Polarization Techniques for Stress Visualization
When transparent materials are placed between two linear polarizers oriented at 90 degrees to each other, a remarkable transformation occurs. The crossed polarizers create vivid interference patterns that reveal internal stress distributions invisible to the naked eye.
Crossed polarizers unlock a hidden world of stress patterns within transparent materials, revealing their invisible internal tensions.
You’ll see colorful displays where each hue represents different stress concentrations, allowing quantitative birefringence analysis.
- Align your polarization axis precisely at 90° angles for maximum stress visibility
- Look for bright colors indicating high stress regions versus darker areas with minimal stress
- Apply this technique to evaluate quality in glass, plastics, and crystalline structures
- Use the resulting patterns to identify potential fracture points in engineering materials
- Compare observed interference patterns against reference standards to quantify stress levels
This visualization method provides critical insights for quality control, forensic analysis, and structural integrity assessment.
Frequently Asked Questions
How Do Temperature Fluctuations Affect Polarization Measurements?
Temperature fluctuations can distort your polarization measurements by changing the optical properties of materials. You’ll see thermal stress inducing birefringence, detector sensitivity shifts, and structural deformations that’ll compromise your data’s accuracy.
Can Polarized Imaging Detect Chemical Composition Differences?
Yes, you can detect chemical composition differences with polarized imaging. It’s effective for identifying substances that alter polarization states differently, revealing molecular structure variations you won’t see in conventional imaging techniques.
What Polarization Techniques Work Best for Living Biological Specimens?
For living biological specimens, you’ll find differential interference contrast (DIC) and polarized light microscopy work best. They’re non-invasive, require minimal sample preparation, and effectively reveal structural details without damaging delicate cells.
How Do Electromagnetic Interferences Impact Polarization Accuracy?
Electromagnetic interferences can distort your polarization measurements by altering light wave orientation. You’ll notice reduced accuracy when strong EMI sources are nearby. Use shielding and maintain distance from electronic equipment for better results.
Are There Standardized Calibration Materials for Different Wavelengths?
Yes, you’ll find standardized materials like polymer films, liquid crystals, and wire-grid polarizers calibrated for specific wavelength ranges. They’re commercially available from optical suppliers and come with certification for different spectral regions.
In Summary
You’ve now mastered the fundamentals of polarized image analysis. Remember that practice makes perfect—you’ll need to apply these techniques regularly to refine your skills. Don’t be discouraged by initial complexity; polarized imaging is a powerful tool that’s worth the effort. Keep your equipment well-calibrated, prepare your samples carefully, and you’ll reveal valuable insights in your microscopy work.
Leave a Reply